|
|
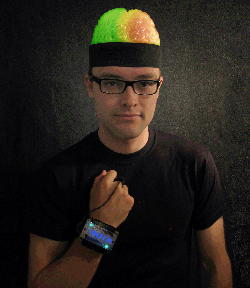
Thinking Cap
A hat that measures the wearer's brain activity from the wearer's
scalp
EEG and projects changes in neuronal synchrony on modular
light arrays. Highly focused attention increases the brain's beta
and gamma oscillations and turns the frontal light modules red,
while entering a meditative state produces large alpha rhythms and
turns the rear light modules red.
|
|
 |
|
|
|
|
|
Also
see my other biofeedback wearables / wearable computing
accessories. |
|
|
|
Tutorial: How
to Measure Your Brainwaves (EEG)
The following materials were prepared for a studio (workshop) "Measuring
Biological Signals: Concepts and Practice" presented
at the
Tangible and Embedded Embodied Interactions
conference, MIT Media Lab, Boston, MA. |
|
|
|
Background: |
|
There are around 100
billion neurons in the brain, which is approximately the
number of galaxies in the universe. To prevent total chaos, the
brain uses rhythmic syncopation at several timescales so
that local networks of neurons can synchronize with one
another and with distant networks to orchestrate elaborate
behaviors. Basically, the idea is that when neurons fire
in synchrony with one another, they are better able to
communicate than when they fire out of sync. |
 |
|
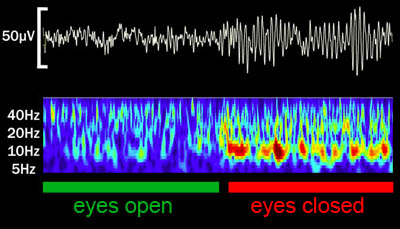
The rhythmic synchrony of
electrical impulses in the brain can be recorded as microvolt
oscillations on the scalp (white trace) and this is called the
Electroencephalograph (EEG). Different behaviors lead
specific brain areas to synchronize at different frequencies. For
example relaxation or meditation with your eyes closed leads to
increased alpha
(8-12Hz) waves over the visual cortex (rear of the head). |
| On the other
hand beta
(14-30Hz) oscillations are associated with active thinking and
concentration, while
gamma
(30-50Hz) oscillations are believed to reflect local neural
processing, commonly activated during focused attention. |
|
|
|
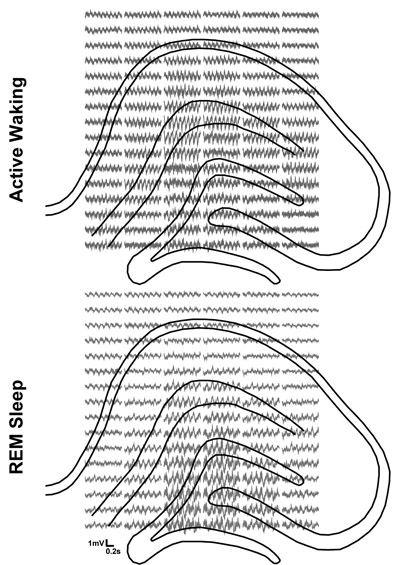
| It should be noted that these
statements are wild simplifications of what's actually
going on in the brain. This figure is from one of
my publications in the Journal of Neuroscience and
shows activity recorded from 96 electrodes regularly
spaced over the
hippocampus, a brain area involved in
learning and memory. Notice how during active waking
there is greater high frequency activity on electrodes
placed in more dorsal (upper) anatomical layers, while
during REM sleep there is greater oscillatory activity
on the electrodes in more ventral (lower) layers. This
change between active waking and REM sleep may reflect
important changes in the mnemonic processing of
different hippocampal subregions. |
 |
|
|
|
Electrodes:
I'm currently using "wet" electrodes that have a
sponge material surrounding the electrode which you must
keep wet with a saline gel (salt and Johnson's baby
shampoo works well). I got these electrodes from a friend
in a neuroscience lab neighboring my PhD lab (sorry no
direct links, but you can find information on the
modeeg site, or by searching for "EEG electrode" in
google).
There are ways to make "dry" electrodes with active
buffering circuitry -
http://openeeg.sourceforge.net/doc/hw/joe_ae/
http://uazu.net/eeg/ae.html
http://www.dcc.uchile.cl/~peortega/ae/
and this is how the
Neurosky headset works,
but I've had limited success in my own attempts.
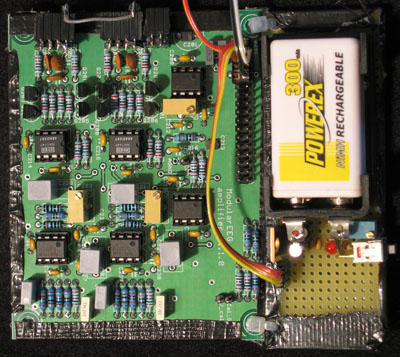
The Thinking Cap uses 4 electrodes, a ground over the
frontal lobe, a reference in the middle of the occipital
cortex, and two recording electrodes bilaterally
placed over the right and left occipital cortex. |
|
|
Amplification:
Since scalp EEG is on the order of microvolts, you need to
amplify the signal by a factor of ~10K-100K.
The 2 electrodes (plus GND & Ref) on the thinking cap feed into an openeeg
modeeg amplifier (which can be purchased at
olimex).
I modified it slightly to increase the max gain and I made a
voltage regulator/splitter circuit to replace the standard digital
board. |
|
 |
|
| |
|
Alternatives:
An alternative to finding
electrodes and doing all the amplification DIY-style, it's
now possible to purchase a single channel off-the-shelf
headset from Neurosky
which sends the raw EEG via bluetooth. In addition to
potentially being easier to set up and using dry
electrodes, this system also ensures user safety by
removing the user from any possible shock hazards
associated with being attached to wall power. The major
drawback is that it has only a single channel, but maybe
this will improve in the next version.
Emotiv
has a headset with many channels, but they are currently
not as DIY friendly due to the fact they will not allow
users access to raw EEG data, but only to their processed
data. Maybe we need some pressure from the DIY community
here or someone to reverse engineer their processor. |
| |
| Analysis: |
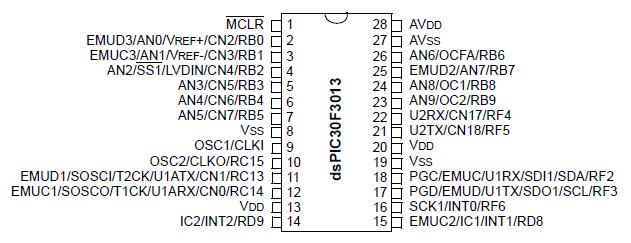
| After amplification, I
read the 2 EEG signals separately into two dspics
(dspic30f3013) |
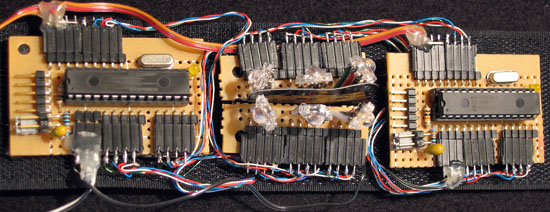 |
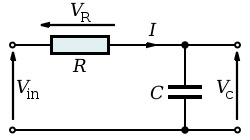
| I use a passive low-pass filter on
the incoming signal (1uF capacitor + 3K3 Ohm resistor
= cut at ~48Hz) to reduce 60Hz noise and higher
frequencies that I won't analyze. |
 |
| |
 |
|
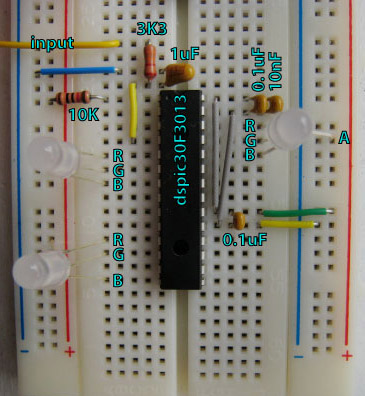
| Here is a a slightly modified
version of this circuit on a breadboard.
This circuit reads the incoming brain
signal and uses an FFT to separate out the power
(amplitude) in 3 specified ranges: Alpha (8-12Hz),
Beta (14-30Hz), and Gamma (30-50Hz). The changes in
power of each frequency band are displayed on 3 RGB
LEDs so that increases in power turn the LED red,
decreases in power turn the LED blue, while power
levels at the averaged baseline appear in the green
range. |
 |
|
|
|
| |
| What is an FFT? |
| Basically, the
FFT (fast Fourier transform) is a method of
decomposing a signal into its different frequency
components. Technically, it's a change of basis from a
time-domain into a new basis consisting of sine and cosine
waves of different amplitudes and phases. |
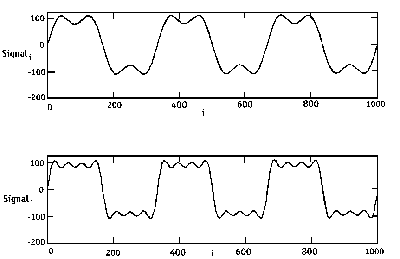
| A classic example is a
square wave. Take a square wave of some arbitrary
frequency, say 1 Hz. You can approximate this square
wave with a single sine wave at 1Hz and capture much
of the wave, but leave a lot left to the imagination.
But, if you add another sine wave at 3Hz (of a lower
amplitude) you can start to fill in those sharp peaks.
Add another sine wave of 5Hz... etc... now we're
starting to see something that looks like a square
wave. In a similar manner you
can decompose any signal into it's frequency
components using the Fourier transform. |
 |
 |
|
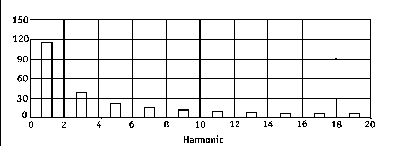
Using a Fourier transform to
calculate the frequency components, or power spectrum, of a 1Hz square wave
reveals the highest power or amplitude in the dominant
frequency, with decreasing power in the harmonic
frequencies that fill in the square edges.
|
 |
|
| |
|
Pic Code:
The code can be found
here:
Under the hood, the pic is essentially performing the
following operations:
(1) Read the data
(2) Low-pass filter
(3) Fill up a signal buffer to pass off to the FFT
(4) Perform the FFT and extract the power in each specified
frequency band
(5) Calculate the mean and standard deviation of the power
over ~20 minutes
(6) Use the mean and stdev to calculate the normalized
changes in power of each band
(7) Change PWM output on LEDs based on deviation of the
power from the average |
| |
| |
| With this outline in
mind, I will now walk through some of the important
variables and steps. |
| SAMPLING_RATE |
|
It is IMPORTANT that this be at
least 256Hz. Although the
Nyquist frequency dictates that the sampling freq
be a minimum of 2x the max freq of interest, at least 4x is much better
for getting decent measurements. |
| FFT_BLOCK_LENGTH |
|
This is how many data points we
will use to calculate the FFT. It is IMPORTANT that
this is at least 2x a full period of our min freq of
interest, better if it's 4x or more. We're using
128/256=1/2=2Hz and our minimum freq of interest is 8Hz, so
we're good. |
| TEMP_BUFF_LENGTH |
|
The length of a temporary buffer we
fill up and copy into the signalBuffer. This allows us
to perform a fast vector copy 256/32=8 times a second
rather than slowly shifting the data on every sample. |
| fractional (variable type)) |
|
Variable type defined on the dspic that is a 16 bit floating point number... really
nice for saving lots of space over 32 bit floats when
you have large arrays. |
| x and y data space |
|
The dspic has two different data
spaces (x & y) that allow faster math operations if
the two variables are put in separate spaces. |
| brainWaves |
|
The brainWaves struct holds a
number of important variables including the frequency
ranges of alpha (8-12Hz), beta (14-30Hz) and gamma
(30-50Hz) oscillations. |
| _ISR _T3Interrupt |
|
Our data sampling interrupt set to
trigger at 128Hz. It is IMPORTANT that this have a
higher priority than other interrupts to avoid
irregular sampling. |
| _ISR _T1Interrupt |
|
This is our LED output interrupt
set to trigger approx every 312uSec. 312*32=0.01Sec=100Hz,
which is fast enough to fool human eye to thinking it
is a constant light source because of
persistence of vision (POV).
This also gives a 32 step (5 bit) resolution for changing
our LEDs from R<->G<->B using
pulse-width modulation (PWM), which looks pretty
smooth. |
| misses |
|
Depending on variable settings,
it's possible to run out of execution time to complete
FFT calculation before another interrupt is triggered.
This could cause real problems if the data wasn't done
copying from one vector to another. To avoid this,
completion of the ProcessData function is tracked and
will not reenter until it is finished. A failed
attempt to run ProcessData is tracked in this
variable. |
| smoothTemp |
|
| It is CRITICAL to low-pass
filter the data before applying the FFT. Any
frequency content of the signal that is above the
Nyquist frequency is reflected an equivalent
amount around the Nyquist. Therefore, if you have
a Nyquist of 128Hz, any power at 129Hz will show
up as power in the 127Hz bin and so on.
This variable is used to smooth
(low-pass filter) the incoming data. This is a
hack. An FIR filter (built in to the dspic
libraries)
should be used instead. |
 |
|
| hanningWin |
|
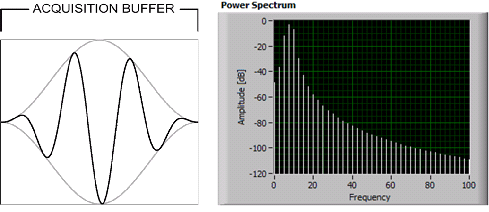
| It is CRITICAL to "taper" or
"window" your signal before applying the FFT. The
FFT mathematically wraps the signal in a circle,
attaching the beginning to the end, so any signal
mismatch between these two somewhat arbitrary
points in time will lead to massive high frequency
noise unless the signal is windowed. Different
window functions have different properties,
but a Hanning window (right) works for us. Note
how below the windowed signal has much less high
frequency noise than the same signal without
windowing. |
_crop.png) |
 |
 |
|
| SquareMagnitudeCplx |
|
The FFT is actually returning the
amplitude and phase information of every frequency.
Squaring the output allows us to look only at
amplitude (power). |
| smoothPeriod |
|
After averaging the power over the
specified frequency range, we smooth the power in the
time-domain to get a more reliable measure. |
| meanPower |
|
We calculate the mean power over a
long period of time (>20 minutes) to get a baseline
power that can be used to estimate how our brainwaves
are changing. |
| sdPower |
|
The standard deviation (also
calculated from >20 minutes) gives us an estimate of
"how large" the changes in power are relative to
previous changes. |
| hue |
|
Calculated from the normalized
changes in power ((power - mean)/stdev), hue is the
color we want to output on the LED. |
| hue2rgb |
|
Function to convert the hue into R, G and B
values 0-255. These are scaled to 0-31 and define the
fraction of time that each color will be on during
each PWM cycle. |
| SetOutputs16bit |
|
Earlier pics had some problems if
you updated the out ports too fast. Because the port
write function proceeds: port read, delay, port
write, it was possible to confuse the pic as to which
port were supposed to be on or off if you had multiple
port writes in succession within the code. This is my attempt
to avoid this problem. |
|
| |
| Also
see my other biofeedback wearables / wearable computing
accessories. |
|
|
| |